
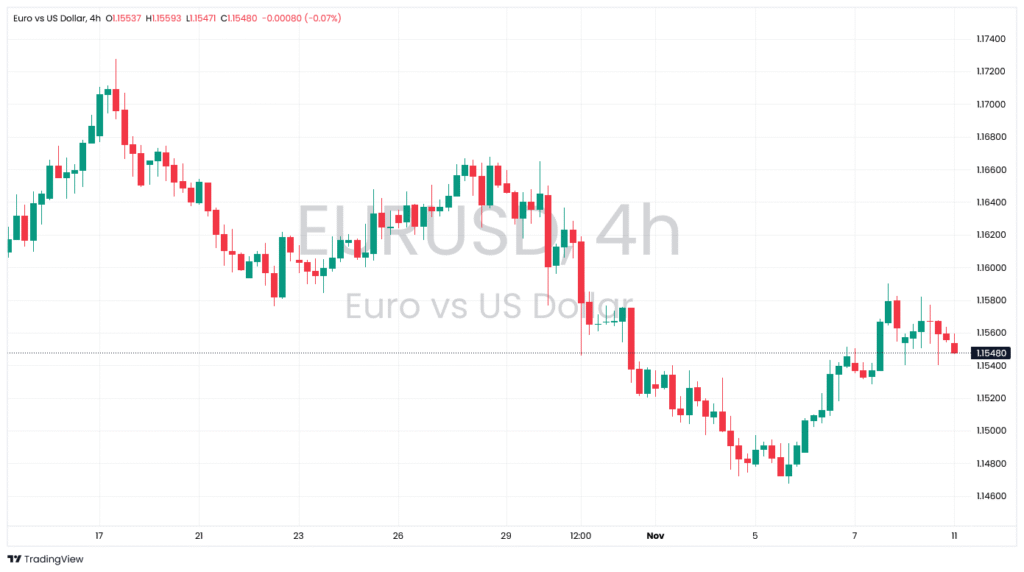
EUR/USD 4H Chart Overview – SELL Signal
The EUR/USD pair is showing clear signs of bearish continuation on the 4-hour timeframe. Price action has consistently formed lower highs and lower lows, confirming a downtrend that began in mid-September. Recent candles show strong rejection near the 1.1600 level, with long upper wicks indicating seller dominance. Despite a minor upward move, bullish momentum appears weak, likely a temporary retracement rather than a reversal.
Technical indicators support this bearish view. Price has failed to break above dynamic resistance zones, likely near the 50/100 EMA. The RSI is estimated to have entered the overbought region (60–70), suggesting a potential reversal. Additionally, price seems to have rejected the 38.2–50% Fibonacci retracement zone from the previous leg down. A minor double top near resistance and tapering volume further reinforce the SELL bias.
Trade Setup Summary
| Parameter | Value |
|---|---|
| Signal |
SELL |
| Entry |
1.1552 |
| Take Profit |
1.1470 |
| Stop Loss |
1.1615 |
📊 Stay Updated with Petra Traders
Visit www.petratraders.com
⚠️ This is not trading advice – it is a pure chart-based signal generated from price structure, trend, and candlestick behavior.
#EURUSD #MarketStructure #Petratraders #MarketAnalysis