
Pattern analysis is one of the most widely used tools in technical analysis. Traders and investors study chart patterns to anticipate the future movement of stock prices, helping them decide when to enter or exit a trade. These patterns are broadly categorized into continuation patterns and reversal patterns, each signaling different market behaviors.
Continuation Patterns
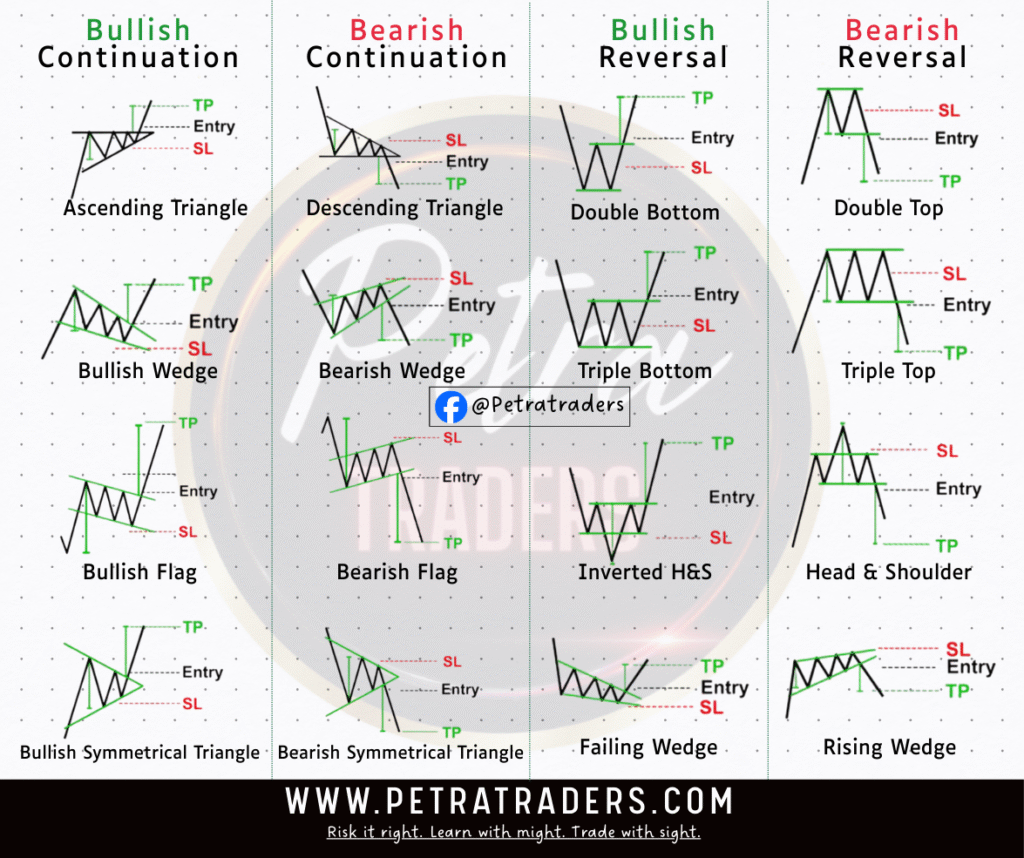
Continuation patterns suggest that the existing trend—whether bullish or bearish—is likely to continue after a brief pause or consolidation.
- Bullish Continuation Pattern
- Occurs during an uptrend.
- Price consolidates or moves sideways after a strong rally, forming shapes like flags, pennants, or ascending triangles.
- Signals that buyers are still in control, and the uptrend is likely to resume once the consolidation ends.
- Bearish Continuation Pattern
- Appears during a downtrend.
- Prices may form descending triangles, bearish flags, or pennants, showing lower lows and lower highs.
- Indicates that sellers remain dominant, and the downward move is expected to continue.
Reversal Patterns
Reversal patterns indicate that the current trend is losing strength and may soon reverse direction.
- Bearish Reversal Pattern
- Develops after an uptrend.
- Signals that buying momentum is fading and sellers are taking over.
- Common examples include head and shoulders, double tops, or rising wedges.
- Once confirmed, prices typically fall, marking the start of a new downtrend.
- Bullish Reversal Pattern
- Forms after a downtrend.
- Suggests that selling pressure is weakening and buyers are regaining control.
- Patterns like double bottoms, inverse head and shoulders, or falling wedges often precede a bullish reversal.
- Once triggered, prices begin to climb, signaling the start of a new uptrend.
✨ Why These Patterns Matter
- They help traders anticipate market moves instead of reacting late.
- Provide entry and exit signals for trades.
- Offer insights into market psychology—whether buyers or sellers are in control.
📊 Quick Summary Table
| Pattern Type | Market Context | Signal Outcome |
|---|---|---|
| Bullish Continuation | Uptrend | Trend continues upward |
| Bearish Continuation | Downtrend | Trend continues downward |
| Bearish Reversal | Uptrend | Trend reverses downward |
| Bullish Reversal | Downtrend | Trend reverses upward |
👉 In short, continuation patterns tell us the trend is taking a breather but will likely continue, while reversal patterns warn that the trend is ending and a new one is about to begin.
 These tools are for educational purposes only and should not be taken as trading advice. Stay informed with Petra Traders.
#BullishPatterns #BearishPatterns #TechnicalAnalysis #StockTrading #MarketTrends #TradingSignals #ChartPatterns #PetraTraders #FinancialEducation #InvestSmart