
🕯️ How to Read Candlesticks: The Ultimate Beginner’s Guide to Forex Trading
Understanding candlestick charts is one of the most important skills in trading. Whether you trade forex, gold, or crypto, candlesticks reveal the psychology of the market — showing who’s in control: buyers (bulls) or sellers (bears).
At Petra Traders, we teach traders to interpret these patterns not just as shapes, but as stories of market behavior. Let’s break it down.
🔹 What Is a Candlestick?
Each candlestick shows price movement over a specific time period — 1 minute, 1 hour, 1 day, etc.
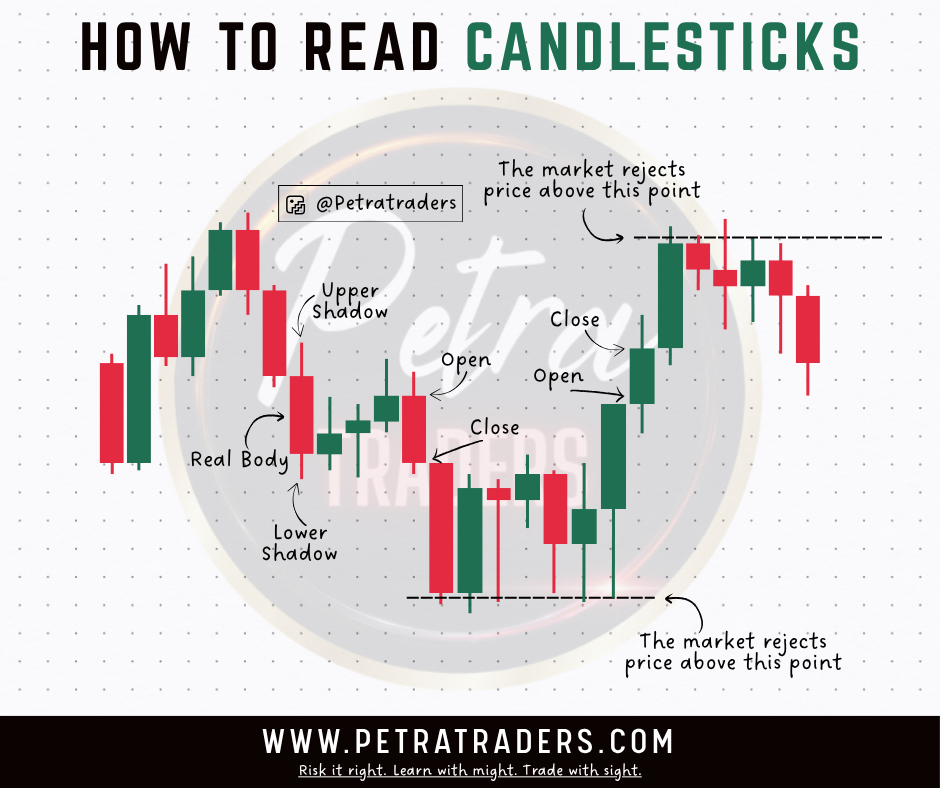
It consists of three main parts:
- Real Body
- The thick portion between the open and close prices.
- 🟩 Green/White: Price closed higher (bullish).
- 🟥 Red/Black: Price closed lower (bearish).
- Upper Shadow (Wick)
- The line above the body shows the highest price reached before the candle closed.
- Lower Shadow (Tail)
- The line below the body shows the lowest price before the close.
Together, these parts reveal how the market behaved within that time frame.
🔹 Reading the Story Behind Each Candle
Candlesticks visualize trader sentiment:
- A long upper wick means price was pushed up but sellers rejected higher levels — a sign of selling pressure.
- A long lower wick shows buyers defended the price from falling further — a sign of buying strength.
- A small body with long wicks (a Doji) means indecision — neither side is winning.
These clues help traders predict where price might move next.
🔹 Market Rejection Zones
In the chart above, notice where price repeatedly gets rejected from certain levels.
- Rejection above → strong resistance (sellers in control).
- Rejection below → strong support (buyers protecting the level).
Identifying these zones helps you plan your entries and exits more effectively.
🔹 Why It Matters for Forex Traders
Candlestick patterns are powerful when combined with:
- Support and Resistance
- Trendlines
- Moving Averages
By understanding the psychology behind the candle, you can anticipate reversals, spot trend continuations, and avoid emotional trades.
At Petra Traders, we always say:
“Risk it right. Learn with might. Trade with sight.”
📈 Example: The Candle in Action
In the sample image, each candle tells part of a bigger story:
- Bullish candles push the market up until sellers step in.
- Bearish candles take over when buyers lose control.
- Rejection wicks mark turning points where the market changes direction.
Mastering this rhythm turns simple price action into a powerful decision-making system.
💬 Final Thoughts
Learning how to read candlesticks is not about memorizing hundreds of patterns — it’s about understanding how traders think.
Once you learn to read the story behind each candle, you’ll trade with confidence and clarity.
📍 Learn More at: www.petratraders.com
📲 Follow us on Instagram: @Petratraders
💬 Risk it right. Learn with might. Trade with sight.
#PetraTraders #ForexEducation #CandlestickAnalysis #PriceActionTrading #LearnToTrade #ForexForBeginners #SmartTraderMindset